From Underperforming to Underutilized: A New Lens for Africa’s Economy
“Introducing the Economic Potential Index as a Policy Compass”

Chapter 1: Introduction
Economic measurement has long relied on standardized indicators such as Gross Domestic Product (GDP), inflation rates, and unemployment figures. These metrics dominate policy debates, international comparisons, and development strategies. However, their design is historically rooted in European and Western economic structures, where formal markets, industrial production, and wage-based employment are the primary engines of growth.
In Sub-Saharan Africa (SSA), these indicators often fail to capture the full reality of economic activity. The region is characterized by a large informal sector, subsistence agriculture, and fragmented value chains. According to the International Labour Organization, more than 85% of employment in SSA is informal, meaning that a majority of economic transactions are not recorded in official statistics. As a result, GDP growth rates and inflation figures provide only a partial and sometimes misleading picture of actual economic performance.
This mismatch between formal indicators and economic reality raises critical questions for policy-making. If governments and international institutions rely on incomplete data, they risk designing policies that overlook the true drivers of livelihoods and resilience in SSA. For example, inflation measured through formal “consumer baskets” may underestimate the price pressures faced by households who purchase food and goods in informal markets. Similarly, GDP growth may appear stagnant even when informal trade and agricultural productivity are expanding.
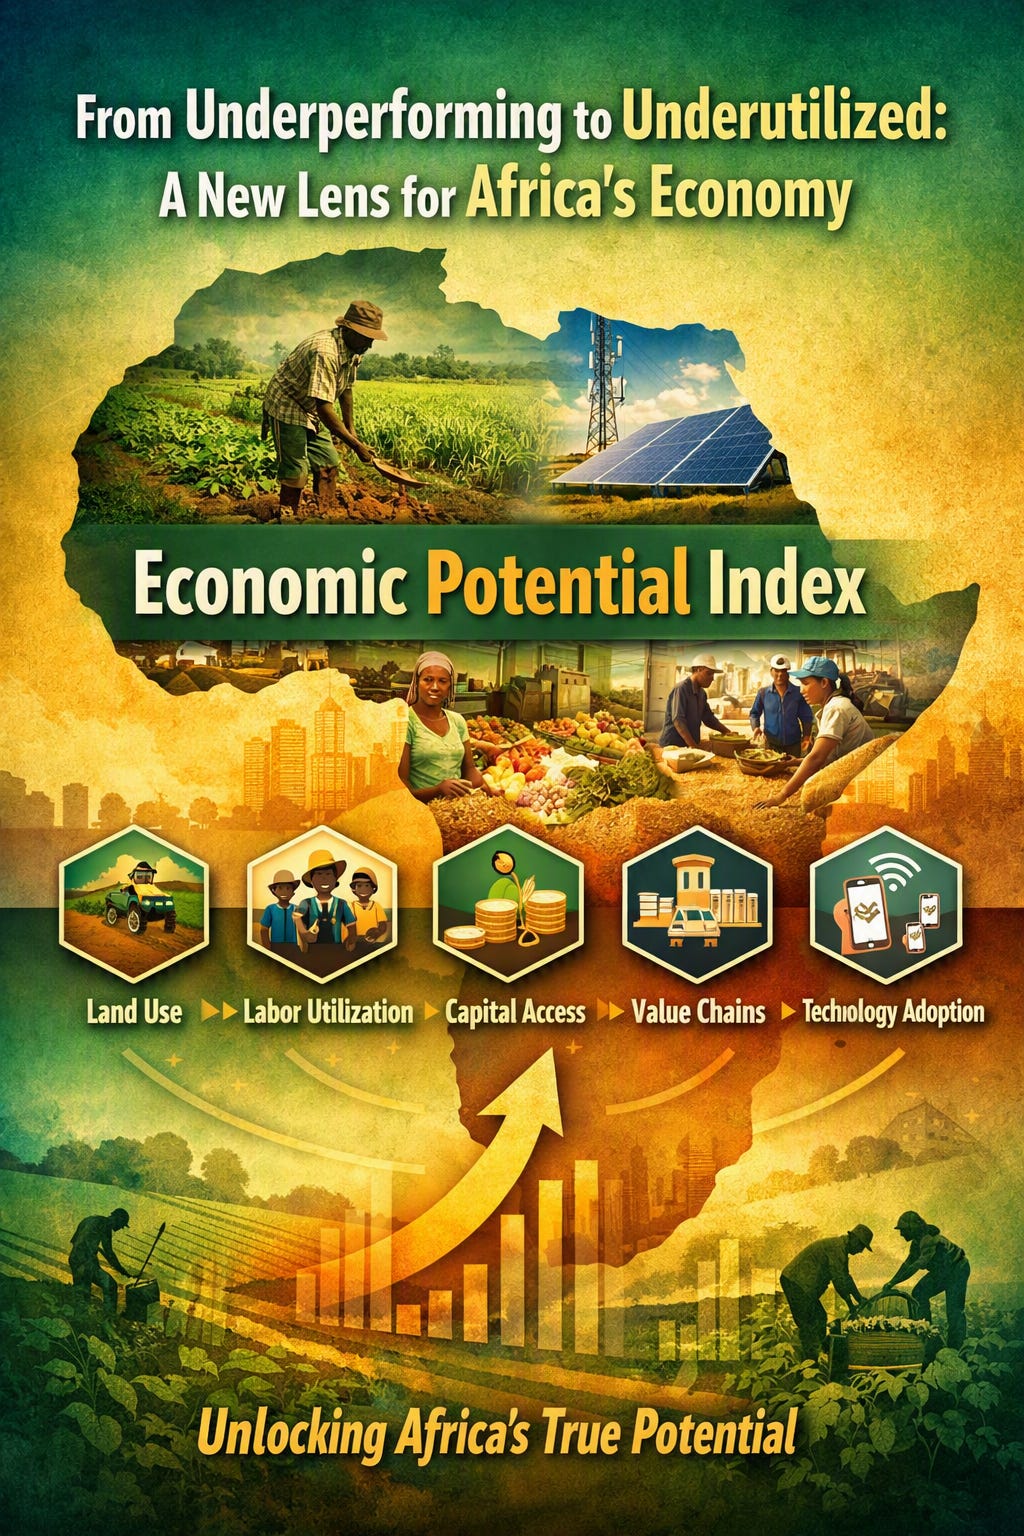
To address these limitations, this essay proposes the development of an Economical Potential Index (EPI). Unlike traditional indicators, the EPI focuses on the gap between available capacity and actual utilization. It measures how much of a country’s agricultural land, labor force, financial capital, and technological resources are being effectively mobilized. By shifting the lens from “formal transactions” to “potential realization,” the EPI offers a more holistic and forward-looking measure of economic performance.
The purpose of this essay is twofold:
To critically examine the shortcomings of conventional economic indicators in SSA.
To present the EPI as a viable alternative that can guide economic policy, investment decisions, and development strategies more effectively.
In doing so, the essay contributes to the ongoing debate about how to measure economic progress in contexts where informality, volatility, and structural constraints dominate. It argues that the EPI can serve not only as a diagnostic tool but also as a policy compass, highlighting areas where untapped potential can be transformed into sustainable growth.
Chapter 2: Limitations of Classical Indicators
Economic policy worldwide has traditionally relied on a set of classical indicators—GDP, inflation, and unemployment—as the primary measures of performance. While these indicators have proven useful in industrialized economies, their application in Sub-Saharan Africa (SSA) reveals significant shortcomings. The structural characteristics of SSA economies—dominated by informality, agriculture, and fragmented value chains—make these indicators incomplete and sometimes misleading.
2.1 Gross Domestic Product (GDP)
GDP is designed to measure the total value of goods and services produced within a country. In Europe and North America, where most transactions occur in formal markets, GDP provides a relatively accurate reflection of economic activity. In SSA, however, the informal sector accounts for more than half of total economic activity. Street vendors, subsistence farmers, and small-scale traders contribute substantially to livelihoods but are rarely captured in official statistics.
For example, in Nigeria, informal trade is estimated to contribute nearly 60% of employment, yet its value is largely absent from GDP figures. This creates a paradox: economies may appear stagnant in official reports, while in reality, informal activity is vibrant and expanding. As a result, GDP growth rates in SSA often underestimate the true dynamism of local economies.
2.2 Inflation
Inflation is typically measured through a “consumer basket” of goods and services, reflecting price changes in formal markets. In SSA, this approach is problematic because most households purchase food and essentials in informal markets, where prices fluctuate differently from formal retail outlets.
For instance, while official inflation in Kenya may report a moderate increase, households in rural areas often experience higher effective inflation due to rising food prices in local markets. Moreover, the composition of the consumer basket often reflects urban consumption patterns, ignoring rural realities. This creates a disconnect between official inflation figures and the lived experience of households, undermining the credibility of monetary policy.
2.3 Unemployment
Unemployment rates are another classical indicator that struggles to capture SSA realities. In Western economies, unemployment is defined as the share of the labor force actively seeking but unable to find work. In SSA, however, most individuals cannot afford to remain unemployed. Instead, they engage in informal or subsistence activities, even if these provide minimal income.
As a result, official unemployment rates in SSA often appear artificially low, masking widespread underemployment and low productivity work. For example, a young person selling small goods on the street may be counted as “employed,” even though their income is insufficient to escape poverty. This misrepresentation hinders effective labor market policy, as governments may underestimate the scale of youth underemployment.
2.4 Implications for Policy
The reliance on GDP, inflation, and unemployment as primary indicators leads to policy distortions in SSA. Governments may prioritize formal sector growth while neglecting informal activity, design monetary policies that fail to address real price pressures, or underestimate the urgency of youth employment challenges. International institutions, relying on these indicators, may also misjudge the resilience or vulnerability of SSA economies.
In short, classical indicators provide a narrow lens that obscures the complexity of SSA economies. They measure what is visible in formal structures but ignore the hidden majority of economic activity. This creates a pressing need for alternative indicators that can capture both formal and informal dynamics, and reflect the true potential of SSA economies.
Chapter 3: Concept of the Economic Potential Index
The limitations of classical indicators in Sub-Saharan Africa (SSA) highlight the need for a new framework that captures the real dynamics of economic activity. The Economic Potential Index (EPI) is proposed as such an alternative. Unlike GDP or inflation, which measure outcomes in formal markets, the EPI focuses on the gap between available capacity and actual utilization. It is designed to reflect both the latent potential of SSA economies and the degree to which this potential is being mobilized.
3.1 Defining Economic Potential
Economic potential refers to the resources, capacities, and opportunities that exist within an economy but are not fully exploited. In SSA, this includes:
Agricultural land that remains underutilized due to lack of irrigation or mechanization.
Labor force, especially youth, engaged in low-productivity informal work rather than formal employment.
Financial capital available through banks, microfinance, and mobile money platforms, but not accessed by smallholders or entrepreneurs.
Value chains that are fragmented, leading to post-harvest losses and inefficiencies.
Technology adoption, where innovations exist but remain inaccessible to rural populations.
By measuring the difference between potential capacity and actual realization, the EPI provides a more accurate picture of economic performance.
3.2 Core Components of the EPI
The EPI is structured around five dimensions, each representing a critical aspect of SSA economies:
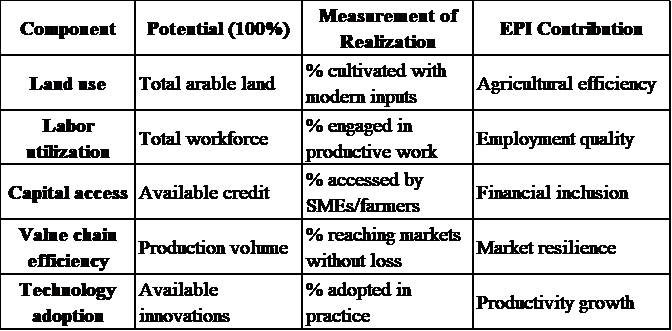
Each component is scored between 0 and 100, reflecting the proportion of potential that is realized. The overall EPI is a weighted average, with weights adjusted to reflect national priorities (e.g., agriculture in Ethiopia, technology in Nigeria).
3.3 Advantages of the EPI
The EPI offers several advantages over classical indicators:
Inclusivity: Captures informal and subsistence activity often ignored by GDP.
Forward-looking: Highlights untapped capacity, guiding investment and policy.
Resilience measurement: Shows how well economies mobilize resources under stress.
Policy relevance: Provides actionable insights for governments, banks, and development partners.
3.4 Illustrative Example
Consider Ghana’s agricultural sector. Official GDP figures capture cocoa exports but overlook the potential of underutilized maize and cassava production. An EPI assessment might show:
Land use: 70% of arable land effectively cultivated.
Labor utilization: 65% of workforce engaged productively.
Capital access: only 35% of farmers accessing credit.
Value chain efficiency: 50% of production reaching markets without loss.
Technology adoption: 25% of farmers using improved seeds or irrigation.
The resulting EPI score would highlight capital access and technology adoption as the weakest links, guiding policy toward financial inclusion and innovation diffusion.
3.5 Conceptual Significance
The EPI reframes economic measurement from a static snapshot of formal transactions to a dynamic assessment of potential realization. It acknowledges that SSA economies are not simply “underperforming” but are underutilized, with vast opportunities for growth if structural barriers are addressed. This makes the EPI not only a diagnostic tool but also a strategic framework for development planning.
Chapter 4: Methodology
Developing the Economic Potential Index (EPI) requires a systematic approach that combines formal statistics, informal economy data, and innovative measurement techniques. Unlike GDP or inflation, which rely on standardized accounting frameworks, the EPI must integrate diverse sources to capture both latent capacity and actual utilization. This chapter outlines the methodological foundations of the index, including data sources, measurement techniques, weighting schemes, and calculation procedures.
4.1 Data Sources
The EPI draws on a mix of traditional and non-traditional data:
National statistics: Agricultural land use, labor force surveys, credit availability.
Household surveys: Informal employment, consumption patterns, access to finance.
Mobile money data: Transactions outside formal banking systems.
Satellite imagery: Land cultivation, irrigation coverage, crop yields.
Market monitoring: Informal price data from local markets.
Technology adoption surveys: Use of improved seeds, mechanization, and digital platforms.
This multi-source approach ensures that the EPI reflects both formal and informal dynamics, overcoming the bias of classical indicators.
4.2 Measurement Techniques
Each component of the EPI is measured as a ratio of realized capacity to potential capacity:
EPIcomponent=Realized CapacityPotential Capacity×100
Examples:
Land use: cultivated hectares ÷ total arable hectares.
Labor utilization: productive employment ÷ total labor force.
Capital access: credit accessed ÷ credit available.
Value chain efficiency: marketed production ÷ total production.
Technology adoption: users of innovation ÷ potential users.
This ratio-based method highlights gaps in utilization, making the EPI a diagnostic tool for identifying bottlenecks.
4.3 Weighting Schemes
The overall EPI score is a weighted average of component scores. Weights are assigned based on national priorities and sectoral importance:
Agriculture-heavy economies (e.g., Ethiopia, Malawi): higher weight on land use and value chain efficiency.
Diversified economies (e.g., Nigeria, South Africa): balanced weights across labor, capital, and technology.
Resource-dependent economies (e.g., Angola): additional weight on capital access and value chain resilience.
This flexibility allows the EPI to be context-sensitive, reflecting the unique structure of each SSA economy.
4.4 Calculation Procedure
Data collection: Gather formal and informal data from multiple sources.
Normalization: Convert all measures into comparable ratios (0–100).
Weight assignment: Apply sector-specific weights to each component.
Aggregation: Compute the weighted average to obtain the overall EPI score.
Validation: Compare EPI results with qualitative assessments (e.g., field studies, expert interviews).
4.5 Challenges and Solutions
Data gaps: Informal activity is difficult to measure. Solution: triangulate surveys, mobile money, and satellite data.
Weighting bias: Different priorities may distort comparability. Solution: publish both weighted and unweighted scores.
Dynamic environments: Rapid changes in markets and climate. Solution: update EPI annually with real-time data inputs.
4.6 Illustrative Calculation
Suppose a country has the following scores:
Land use: 70
Labor utilization: 65
Capital access: 40
Value chain efficiency: 55
Technology adoption: 30
With equal weights, the EPI would be:
EPI=70+65+40+55+305=52
This score indicates that only 52% of economic potential is currently realized, highlighting areas for targeted policy intervention.
Summary
The methodology of the EPI combines multi-source data, ratio-based measurement, and context-sensitive weighting to create a robust indicator of economic potential utilization. By addressing data gaps and integrating informal activity, the EPI provides a more realistic and actionable measure for SSA economies than classical indicators.
Chapter 5: Application in Policy
The Economic Potential Index (EPI) is not merely a diagnostic tool; it is designed to serve as a policy instrument that can reshape how governments, financial institutions, and international partners approach economic development in Sub-Saharan Africa (SSA). By focusing on the gap between potential and realization, the EPI provides actionable insights that classical indicators fail to deliver.
5.1 Government Policy
Governments in SSA often rely on GDP growth and inflation figures to design macroeconomic strategies. These indicators, however, overlook the informal sector and latent capacity. The EPI enables governments to:
Target investment: Identify sectors with high potential but low utilization, such as underused agricultural land or unproductive youth labor.
Design inclusive policies: Incorporate informal activity into national planning, ensuring that policies reflect the realities of households and small enterprises.
Monitor resilience: Track how well economies mobilize resources during crises, such as droughts or price shocks.
Prioritize structural reforms: Focus on bottlenecks in value chains, such as logistics inefficiencies or lack of storage facilities.
For example, if the EPI reveals that only 35% of available credit is accessed by farmers, governments can design policies to expand microfinance, reduce collateral requirements, or promote mobile money platforms.
5.2 Financial Institutions
Banks and development finance institutions often struggle to assess risk in SSA due to limited data. The EPI provides a framework to:
Evaluate creditworthiness: By linking capital access to actual utilization, lenders can better understand repayment capacity.
Identify investment opportunities: Highlight sectors where potential is high but underutilized, such as agribusiness or renewable energy.
Support risk-sharing mechanisms: Encourage insurance schemes and cooperative financing by showing where vulnerabilities exist in value chains.
This makes the EPI a valuable tool for aligning financial products with the realities of SSA economies, reducing risk while expanding access to capital.
5.3 International Development Partners
Donors and multilateral organizations often rely on GDP and poverty statistics to allocate resources. The EPI offers a more nuanced perspective by:
Highlighting untapped potential: Demonstrating that SSA economies are not simply “low-performing” but underutilized.
Guiding aid allocation: Directing resources to sectors where capacity exists but is blocked by structural barriers.
Measuring impact: Tracking improvements in potential utilization over time, rather than just changes in formal GDP.
For instance, an EPI score showing low technology adoption could justify donor investment in digital infrastructure and farmer training programs.
5.4 Local Communities and Entrepreneurs
At the micro level, the EPI can empower communities and entrepreneurs by:
Identifying constraints: Showing where local production is lost due to poor storage or transport.
Strengthening cooperatives: Encouraging collective action to overcome barriers in capital access or market entry.
Promoting innovation: Highlighting the benefits of adopting new technologies, from mobile payments to improved seeds.
This bottom-up application ensures that the EPI is not only a macroeconomic tool but also a practical guide for local development strategies.
Summary
The EPI transforms economic measurement into a policy compass. By revealing where potential is underutilized, it enables governments to design inclusive policies, financial institutions to reduce risk, international partners to allocate aid effectively, and communities to mobilize resources. In this way, the EPI bridges the gap between statistical abstraction and real-world economic transformation.
Chapter 6: Conclusion
The reliance on classical economic indicators such as GDP, inflation, and unemployment has long shaped global economic policy. Yet, in the context of Sub-Saharan Africa (SSA), these measures are increasingly inadequate. They capture only the formal economy, leaving vast areas of informal activity, subsistence agriculture, and latent capacity unmeasured. As a result, they provide a partial and sometimes distorted picture of economic performance, leading to policies that fail to address the realities of households, farmers, and entrepreneurs.
The proposed Economic Potential Index (EPI) offers a compelling alternative. By focusing on the gap between potential and realization, the EPI reframes economic measurement from a static record of formal transactions to a dynamic assessment of capacity utilization. Its five components—land use, labor utilization, capital access, value chain efficiency, and technology adoption—capture the structural features that define SSA economies. Through ratio-based measurement and context-sensitive weighting, the EPI provides a more holistic, inclusive, and forward-looking indicator.
The policy applications of the EPI are significant. Governments can use it to design targeted investments and inclusive reforms. Financial institutions can better assess risk and identify opportunities. International partners can allocate aid more effectively, focusing on sectors where untapped potential is greatest. Local communities and entrepreneurs can identify constraints and mobilize collective action. In this way, the EPI functions not only as a diagnostic tool but also as a policy compass, guiding strategies that unlock economic resilience and sustainable growth.
Ultimately, the EPI challenges the prevailing narrative that SSA economies are “underperforming.” Instead, it demonstrates that they are underutilized, with vast reserves of land, labor, capital, and innovation waiting to be mobilized. By shifting the focus from outcomes to potential, the EPI redefines economic progress in SSA as a process of transforming latent capacity into realized prosperity.
This essay has argued that the EPI is more than an academic construct; it is a practical framework for rethinking economic policy in SSA. If adopted, it could reshape how development is measured, how resources are allocated, and how resilience is built in the face of global challenges. In doing so, the EPI offers a new lens through which SSA economies can be understood—not as marginal players in the global economy, but as regions of immense potential whose future depends on how effectively that potential is harnessed.